- Research
- Open access
- Published:
Dispersal and seasonal movements of Pacific halibut (Hippoglossus stenolepis) in the eastern Bering Sea and Aleutian Islands, as inferred from satellite-transmitting archival tags
Animal Biotelemetry volume 10, Article number: 18 (2022)
Abstract
Background
Understanding connectivity is critical to the management of exploited fish stocks, but migratory dynamics of Pacific halibut (Hippoglossus stenolepis) in the Bering Sea and Aleutian Islands region are not well-understood. In the current study, 145 Pacific halibut ≥ 82 cm fork length were tagged with Pop-up Archival Transmitting (PAT) tags to evaluate interannual dispersal, seasonal migration, and depth-specific habitat use.
Results
Endpoint locations obtained after 1 year at liberty (n = 79), fishery recoveries after 2–3 years at liberty (n = 5), and at-liberty geopositions based on light data (n = 5313 estimates from 109 fish) indicated geographically distinct movement patterns: Pacific halibut tagged in the Western and Central Aleutian Islands remained within the island groups in which the fish had been tagged; fish in the eastern Bering Sea remained in that ocean basin, moving among International Pacific Halibut Commission (IPHC) regulatory areas and into Russian waters; those tagged south of Unimak Pass in IPHC Regulatory Area 4A displayed the greatest amount of emigration, dispersing eastward both seasonally and interannually to as far south as Washington State. Analysis of daily maximum depth and temperature data from 113 individuals demonstrated group-level variation in summer temperatures experienced by the fish and in the timing, duration, and synchrony of movement to deep-water wintering grounds.
Conclusions
Depth-specific habitat use was suggestive of regionally explicit migratory contingents, while interannual dispersal patterns were consistent with the existence of multiple functional spawning units. The results may guide future research to examine cross-basin connectivity in the Northern Bering Sea and provide inputs for numerical modelling of individual movements, larval advection, and recruitment analyses.
Background
Pacific halibut (Hippoglossus stenolepis) is a wide-ranging Pleuronectid flatfish species distributed from northern California, USA, northward throughout the Gulf of Alaska and Bering Sea, westward into the Russian Sea of Okhotsk, and southward into the northern Sea of Japan. These fish are highly migratory, with complex and widely dispersing life-history stages [1]. The species supports substantial subsistence, recreational, and commercial fisheries [2] and although managed as a single unit stock throughout US and Canadian waters [3] research conducted in North American waters suggests internal population structure at roughly ocean-basin scales [4]. Data collected using Pop-up Archival Transmitting (PAT) tags are consistent with the hypothesis that mature fish have a higher probability of remaining within the basins of the eastern Pacific Ocean (defined as the Gulf of Alaska, eastern Bering Sea, and the Aleutian Islands region) to spawn than dispersing among basins to do so [4, 5]. Consistent with this, although population genetic analyses have demonstrated little genetic differentiation throughout North American waters [6, 7], best-available evidence suggests that the western Aleutian Islands may support a population component that is significantly different than in either the eastern Pacific Ocean [6, 7] or in Asian waters of the southern Sea of Okhotsk [7].
However, neither existing satellite-tag data nor genetic analyses provide insight into connectivity at the annual to multi-annual scales over which Pacific halibut fisheries are managed and prosecuted or the decadal-scale processes comprising the ontogeny of a species in which 8–16 year-olds are the most-represented demographic in the directed fishery [3] and is known to live in excess of 50 years [8]. Satellite tagging has primarily investigated seasonal dispersal (i.e., movements executed over the course of 6–7 months), while genetic studies speak to reproductive isolation over hundreds to thousands of years. As such, there is a need to conduct adult connectivity studies ranging from interannual to generational-scale to bridge this gap.
Perhaps the most substantial effort to better understand interannual dispersal in Pacific halibut was a large-scale Passive Integrated Transponder (PIT tag) study conducted along the North American coast between 2001 and 2009 [9]. Over the course of that study, 67,000 fish were tagged and > 3000 were recovered via intensive dockside sampling. Statistical modeling of the recovery distributions, along with analyses derived from a long history of conventional tagging [10, 11], provided considerable insight regarding migration among geographic areas, including relationships between movement rates and fish size. However, these results were subject to limitations due to the nature of the tags and the recovery mechanism [1]. Conventional tag recoveries (including PIT tags) are dependent primarily upon commercial fisheries and, thus, relatively little information can be obtained in regions, where fishing effort is low or within which the mixing of tagged fish into the fishable population is incomplete [9]. As a result, limited insight was obtained regarding dispersal within the Bering Sea and Aleutian Islands (BSAI) region or between the BSAI region and the Gulf of Alaska (GOA). Also, the PIT tags were implanted subcutaneously with no external markings placed on the fish; the tags could only be detected electronically. Thus, the location data were limited to the scale of entire fishing trips: i.e., it was known within which commercial offload each fish had been recovered, but not the precise recapture location or date. In addition, Pacific halibut are known to conduct seasonal spawning migrations that are composed of both onshore–offshore movement [5, 12, 13] and large-scale (> 1000 km) alongshore redistribution [5, 13,14,15,16]. Without constraining recoveries to a relatively short window representing the summer feeding period [12] or having the ability to evaluate each fish’s individual’s location within its seasonal migration trajectory, seasonal movement may be confounded with interannual dispersal, whether ontogenic [10] or due to adult straying [17]. Resolving among forms of dispersal can be important for understanding how fish movements interact with target [sensu 18, 19] and non-target [sensu 20, 21] fisheries, and for properly defining regional stock components [sensu 3] intended to reflect effective spawning biomass units [sensu 4].
In the current study, interannual connectivity in Pacific halibut was investigated using PAT tags. In brief, PAT tags are electronic tags that contain an automated release mechanism, sensor package, and satellite-broadcast capabilities, allowing for environmental data to be collected while attached to the host fish. Recovery/broadcast dates (and, hence, period at liberty) may be pre-specified, and the tag’s final position is determined by the receiving satellite [22]. This has the advantage of allowing for determination of final location even if fish move to areas absent of fishery effort, such as where fisheries are excluded (e.g., the IPHC Closed Area; Fig. 1), or where reporting of physical recoveries is reduced (e.g., in Asian waters for fish tagged in North America). In addition, locations during time at liberty can be inferred from archived light data [sensu 23] and may allow for state-space modelling of movement [24,25,26] that cannot be achieved using conventional mark-recapture data. PAT tags have been used to investigate seasonal movements in Pacific halibut; in particular, identifying key spawning grounds in the BSAI region and their connectivity to components of the commercial fishery [13]. However, due to their relatively high cost (~ $4000 US), the distribution of such releases has been patchy and has lacked coverage in one region that may be key to understanding basin-scale stock structure in Pacific halibut: adjacent to Unimak Pass (Fig. 1), which represents a primary connection between the Eastern Bering Sea (EBS) and Gulf of Alaska (GOA), from both an oceanographic [27] and biological [28, 29] perspective.
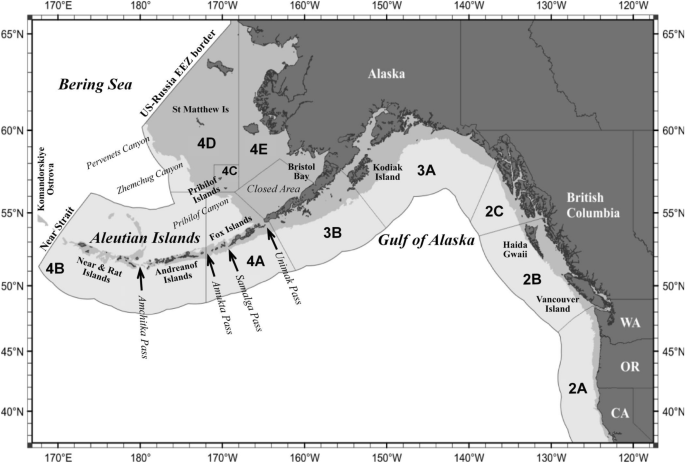
International Pacific Halibut Commission regulatory areas and geographic features referenced in this manuscript. Note that the western Aleutian Islands (i.e., the Near and Rat Islands) are located in the eastern hemisphere, with IPHC Regulatory Area 4B crossing the Antimeridian at approximately Amchitka Pass
Here, we use satellite-generated final positions, fishery-recovery locations, at-liberty longitudes estimated from ambient light data, and depth trajectories during time-at-liberty [sensu 12] to infer regional variation in interannual dispersal, the timing and duration of seasonal migrations, and depth-specific regional habitat use of Pacific halibut in the BSAI region and in the western GOA adjacent to Unimak Pass.
Methods
Tag deployments
A total of 145 Pacific halibut were tagged with either Wildlife Computers (Redmond, Washington, USA) Mk10 or with Lotek Wireless (St. Johns, Newfoundland, Canada) PSAT Flex Pop-up Archival Transmitting (PAT) tags during the boreal summers (June–August) of 2008 and 2009 (Mk10), and during June 2016 (PSAT Flex) (Table 1). All fish were captured during the IPHC’s Fishery-Independent Setline Survey (FISS) [30] using benthic longline gear rigged with 16/0 circle hooks at 5.5 m spacing, baited with chum salmon (Oncorhynchus keta), and soaked for approximately 6 h prior to retrieval. Fish that were in excellent condition and of commercially legal size [i.e., ≥ 82 cm fork length (FL)] were tagged at pre-selected and regularly spaced stations throughout the BSAI and far-western GOA (Fig. 2). Individual fish were randomly selected at each station to achieve a tagged demographic that was representative of the surveyed population.

Deployment and endpoint locations of Pacific halibut (Hippoglossus stenolepis) tagged with pop-up archival transmitting tags during the boreal summers of 2008, 2009, and 2016. Colors represent five geographic regions within which individuals were pooled for analysis. Only fish whose tags produced data are plotted. Circles indicate tagging locations, where closed symbols represent final locations that were amenable to analyses of interannual dispersal; open symbols are fish whose final locations were not included but which produced depth or light data. Open diamonds connected by solid lines indicate final positions after 1 year at liberty; dashed lines indicate fish that were physically recaptured after 2–3 years at liberty. The precise location of one fish that was recaptured in coastal Kamchatkan waters was unknown, and is denoted with a question mark. Note that Kamchatka and the Western Aleutians are located in the eastern hemisphere, with Antimeridian located at approximately Amchitka Pass in the south and the western Gulf of Anadyr in the north
Mk10 PAT tags measured 170 mm in length and 40 mm in maximum diameter, with a plastic-coated braided-cable antenna protruding from the distal end. PSAT Flex tags measured 131 mm in length and 42 mm in maximum diameter, also with a distal antenna. The tags were programmed to record depth (at a resolution of 4 m) every 30 s and ambient light levels every minute and, upon surfacing, to transmitting their data to the US National Oceanic and Atmospheric Administration’s polar-orbiting satellites, administered by the Advanced Research and Global Observation System (Argos). For tags that were not physically recovered prior to their programmed broadcast dates, archived environmental data were transmitted as aggregated (“binned”) depth data, depth profiles, and light-based twilight curves that could subsequently be used to define habitat use and estimate location during time-at-liberty. Depth data were binned into consecutive 8-h blocks that included the minimum and maximum depths experienced by the fish during each binning period.
During tagging, the fork length of each tagged fish was recorded and tags were secured to the fish via 15–18 cm leaders of 130-kg test nylon monofilament coated with adhesive-lined polyolefin, anchored to the fish using surgical-grade titanium darts that were inserted through the pterygiophores on the eyed side of the fish, roughly 2.5 cm medial to the dorsal fin. Tag assemblies weighed approximately 120 g in air, representing 0.15–1.5% of the initial body weights of the tagged fish as estimated from their lengths [31]; however, the tags were slightly (i.e., < 5 g) buoyant in water. The tags were programmed to detach and report during the non-spawning (feeding) period, 365 days after deployment, thereby producing endpoint data representing interannual dispersal that was absent of seasonal migration to the greatest degree possible. Mk10 PAT tags were programmed to report within 2 days of the occurrence of any premature release event (i.e., upon floating to the surface prior to the programmed date of detachment). PSAT Flex were not equipped with surface-detection capabilities and, therefore, only initiated satellite broadcasts on the programmed tag-detachment date. For both tag types, the dart-and-tether assemblies remained embedded in the fish following tag detachment to serve as a conventional tag that allowed for a third location to be obtained if the fish were subsequently recaptured. Both the tag bodies and tethers were printed with tag numbers and contact information and unique identification numbers were also engraved on the tagging darts.
Tagging regions
The analyses contained herein are intended to describe dispersal patterns during the summer feeding period, within geographic regions that represent biological subunits at fishery-relevant scales. In particular, prior migratory [4] and genetic [7] research has suggested that east–west movement of Pacific halibut may be limited by deep-water passes through the Aleutian Island Chain (i.e., at Amchitka and Amukta Passes; Fig. 1). Tagging studies have demonstrated different rates and distances of dispersal for Pacific halibut found north versus south of Unimak Pass [9]. Analyses also suggest that fisheries of shallow island ecosystems in the Eastern Bering Sea (EBS) may display different dynamics than farther offshore [32, 33]. Thus, for the subsequent analyses, data were grouped by tag-deployment location within geographically distinct regions (Fig. 2): (1) the Western Aleutian Islands, representing all waters south of 55.5° N lat. and west of a line extending from 51° N lat. by 180° W lon. (i.e., Amchitka Pass) to 54° N by 178° W; (2) the Central Aleutian Islands, representing waters south of 53° N and between 171.7° W (i.e., Amukta Pass) and a line extending from 51° N by 180° W to 54° N by 178° W; (3) the BSAI-GOA Transition Zone, representing southern IPHC Regulatory Area 4A and spanning 164–171.7° W so as to include all waters south, and within 40 km to the north, of the Fox Islands (i.e., representing a region of mixing among the eastern Aleutian Islands, far-western GOA, and around Unimak Pass); (4) the Eastern Bering Sea Shelf Edge, representing waters of the continental shelf edge from 135 to 500 m depth, north of 54.6° N, and spanning 165.4–178.5° W, and; (5) the Eastern Bering Sea Shelf Islands, representing shallow (< 105 m) water within 40 km of St. Matthew Island and the Pribilof Islands. In a Pacific halibut management context, the Western and Central Aleutian Regions comprise the western and eastern halves, respectively, of IPHC Regulatory Area 4B; the Transition Zone comprises southern Regulatory Area 4A; the EBS Shelf Edge spans northern Area 4A and the offshore extent of Regulatory Area 4D; and the EBS Shelf Islands are contained within Regulatory Areas 4C (Pribilof Islands) and 4D (St. Matthew Island) (Figs. 1 and 2).
Final locations, linear displacement, and interannual dispersal
Final fish locations were obtained for fish that were either recaptured in fisheries or whose tags reported through the Argos satellite system. Tag rewards were offered to individuals who captured tagged fish, as well as for tags found adrift or awash following their detachment. Final locations for the recaptured fish reported herein represent the coordinates that were provided to the IPHC by the individuals who returned those tags. For tags that successfully reported via satellite, positions were determined by the receiving satellite(s) from the Doppler shift of the transmitted radio frequency in successive uplinks received during each satellite pass [22]. Each satellite-generated position estimate was assigned a “location class” by Service Argos that indicated the positional accuracy of the estimate; locations reported herein represent the first broadcast for each tag for which positional accuracy was reported to be < 1000 m. Mk10s that detached earlier than their scheduled date were programmed to broadcast upon surfacing if they remained at zero depth for a 2-day period; locations reported herein represent the first position obtained thereafter. Tag drift that may have occurred between tag surfacing and reporting was not estimated. PSATs were not equipped with zero-depth premature-release detection and were, therefore, programmed to report only after 365 days at liberty. As such, reliable final locations for fish whose PSATs detached prematurely could not be obtained and these locations were omitted from analysis.
For analyses of interannual dispersal, only fish whose final positions were obtained after 1 full year at liberty were included; herein defined as occurring within a window of 360–370 days after tagging. Positions obtained after shorter or longer periods were omitted, because they had the potential to be biased due to seasonal migration, which may be substantial in magnitude [4, 5]. Such endpoints may be more representative of spawning/wintering locations than the locations to which those fish would have migrated the following summer, whether displaying homing behavior [14, 17], straying [17], or engaged in ontogenic redistribution [9]. The dispersal of individuals whose locations were obtained during the winter spawning period has been reported elsewhere [4]. Herein, interannual displacement between mark and reporting was calculated for each fish included in the analysis as the linear distance between its tagging location and either its physical recapture or first accepted satellite-derived reporting position, ignoring land masses that might lie between those endpoints.
At-liberty position estimation
Daily longitude estimates of tagged Pacific halibut during their times at liberty were estimated using archived ambient light data. MK10 PAT tags were programmed to identify and broadcast “twilight events” in which light levels either increased or decreased at rates that were consistent with sunrise and sunset, respectively. Wildlife Computers’ proprietary software Global Position Estimator version 3 (GPE3) was used to extract the twilight data from each tag’s broadcast file, and each twilight event (i.e., a series of nine sequential light readings) was visually inspected. Putative sunrise/sunset events that did not exhibit smoothly sloping light levels or contained null values were rejected. In addition, twilight events were rejected if the fish displayed a change in depth during the putative event such that the changing light levels might have resulted from vertical movement as opposed to true sunrise or sunset; e.g., light levels declining as a fish descended. Curves were not rejected if a fish’s depth change was inverse to the slope of the twilight event; e.g., light levels increasing as a fish descended. The latter would be consistent with crepuscular vertical migrations and provide additional evidence that the event was truly sunrise/sunset. Days on which only one twilight event was identifiable were omitted, because the timing of individual twilight events can be biased relative to true twilight due to water clarity or cloud cover. In contrast, the mean of two similarly biased events during a single day may still result in an accurate estimate of solar noon, and so all days in which both sunrise and sunset could be characterized were included in the analysis.
Longitude was calculated from twilight data by: (1) computing local solar noon as the mean of the mid-sunrise and mid-sunset times; (2) adjusting local solar noon to the nearest minute (i.e., at the same resolution as the light data) in accordance with the Equation of Time [34] for the given date; (3) comparing the adjusted local noon to 1200 UTC (Coordinated Universal Time), wherein each hour of offset between those two times indicated 15° of longitude relative to the Prime Meridian.
When longitude is known, latitude may be determined based on day length on any given date. However, light-based latitudes were not estimated herein, because results for Pacific halibut have been found to be highly variable [35] due to reductions in estimated day length that arise from cloud cover and water turbidity in the North Pacific Ocean. In addition, changes in the vertical distribution of the tagged fish from day-to-day and seasonally can introduce intractable variance and bias into twilight-derived estimates of local day length.
Plots of light-based longitude estimates according to date (i.e., demonstrating potential east–west dispersal during time at liberty) were constructed for each fish and using regionally aggregated data. Inferring the displacement of Pacific halibut from light-based longitude is somewhat subjective, because factors that skew light readings taken at depth can introduce variability into those estimates, even for relatively stationary tags [35]. Isolated position estimates must be considered cautiously, whereas series of positions located consistently away from a point of reference are more likely to indicate displacement of the fish. Individual outliers are often easy to identify within individual trajectories (e.g., Fig. 3a); series of positions estimates were evaluated for plausibility considering the magnitude of displacement that they nominally suggested with respect to their distance from known release-recovery locations and other light-based longitude estimates over the time elapsed between consecutive position estimates. Herein, series of estimates that suggested smoothly trended east–west redistribution were considered plausible. Series of five or more “clumped” estimates were evaluated for plausibility on the basis of their distance from prior and subsequent positions. Implied displacement was considered implausible if it could only have been reached from the nearest series of prior plausible position estimates by the fish having swum continuously at ≥ 2 m per second for consecutive 24-h periods without resting.

Light-based longitude estimates (upper panels) and daily maximum depth profiles (lower panels) during periods at liberty (2008 and 2009) of: a one Pacific halibut tagged in the Western Aleutian Islands, from date of tagging (top of upper panels) to date of final tag reporting (bottom of upper panels), and; b, c two Pacific halibut (Hippoglossus stenolepis) tagged with pop-up archival transmitting tags in the far-western Gulf of Alaska. All data were obtained via satellite transmission (i.e., the tags were not recovered). The approximate longitudinal span of International Pacific Halibut Commission regulatory areas is indicated by shading; note that the Western Aleutians are located in the eastern hemisphere, with the Antimeridian bisecting IPHC Regulatory Area 4B at approximately Amchitka Pass. The fish depicted in a remained in shallow water throughout the year and the light data provide no evidence that it departed its tagging location. However, note the single outlier position in early June of 2009: this likely represents a biased daylight curve, as the position is farther eastward than a Pacific halibut could likely swim during the time elapsed relative to the remainder of the position estimates. The fish depicted in b and c emigrated from their tagging region and had final tag-reporting locations in the Gulf of Alaska and coastal Washington State, respectively; the timing of their migrations was coincident with their movement to deep water in autumn
In addition to plotting estimates over time, group-level at-liberty redistribution was evaluated using longitude estimates that were standardized relative to each individual’s known initial location, as: (Loni − Lont), where Loni = the longitude at the initial (tagging) location and Lont = light-based longitude estimate at timet. That is, each light-based longitude estimate was expressed as being X° either to the west (negative values) or east (positive values) of the fish’s known initial location. The data were then pooled by region and plotted as frequency histograms. Those distributions were inspected to evaluate whether they were described by a single mode or multiple modes. For each mode that was identified, mean, median, and skewness were calculated. Median and skewness values near 0 would indicate little net directional shift in at-liberty fish distributions relative to known tagging locations; negative values would indicate net westward redistribution; and positive values eastward redistribution.
Seasonal depth distributions
Depth data were analysed to characterize depth-specific habitat use and the extent and timing of migration to deep-water spawning grounds. Herein, it was assumed that Pacific halibut spend considerable time at or near the seafloor each day, such that the maximum depth recorded during each 8-h data-binning period was likely to represent seafloor depth, and multiple analyses were conducted using all tags within each geographic region for which maximum-depth data were obtained (Table 1). A primary objective was to evaluate the degree to which seasonal migration may vary by region. Such movements are typically composed of offshore migration in the autumn with return to shallow waters in the spring. Prior research [4] has compared geographic variance in seasonal habitat use by defining a fixed spawning period among all regions of interest that was equivalent to the period over which active spawning (i.e., spawn-rise behavior) [36] has been reported from archival-tagging data [12, 37]. However, the high-resolution data required to confidently conduct spawn-rise analyses [38] for Pacific halibut are primarily limited to the GOA and applying any single spawning period to all regions within an analysis may fail to capture important geographic differences in spawn timing; and, in the current context, offshore–onshore migrations that occur prior to, and after, the active spawning are of considerable interest. Herein, the available depth data were used to define regionally explicit summer shallow-water and winter deep-water phases after standardizing data resolution among all tags analyzed by converting high-resolution (i.e., 30 s) data from physically recovered tags to 8-h-binned minimum and maximum values. Each region’s pooled, average annual depth profile was divided into two periods representing the occupation of habitat that was either shallower than, or deeper than, the region’s population-level annual mean. First, mean depth within each region was computed among all individuals for all available binning periods throughout deployment. Next, a regionally explicit annual mean depth occupied was calculated using the longest duration for which data were contiguously available among regions: i.e., 21 June of the year of tagging through 3 June of the year of tag-reporting. Then, mean maximum daily depth (MMDD) profiles [sensu 12] were constructed for each region as 3-day moving averages of the binned data (i.e., averaged across twelve consecutive 8-h bins), to smooth short-period fluctuations. Each region’s deep-water (spawning) phase was then defined as the longest period over which the smoothed mean depths were continuously deeper than the region’s annual mean depth occupied; and the shallow-water phase defined as the remainder of the year. Maximum depth data for each fish were then inspected to determine individual deep-water phases, similarly defined as the longest temporally consistent period (i.e., occurring during boreal winter, as per the regional mean profile) during which that individual persistently occupied depths deeper than the pooled regional mean. These data were then used to identify the deep- and shallow-water phases for each individual and compute mean depth within each phase (i.e., deep-water and shallow-water) for those individuals. Individual mean depths were then averaged to derive regionally explicit mean depths occupied during each depth phase; this eliminated, to the greatest degree practicable, biasing the regional means in favor of fish whose tags transmitted more data than others.
To investigate whether water temperature might influence the timing of the autumn offshore migration, conditions experienced by migratory individuals were compared among geographic regions. Migratory individuals were defined as those that moved to depths below the regional mean annual depth in autumn and remained in deep water for at least 4 weeks thereafter. For each such individual, mean temperature experienced during the 6-week period spanning 28 July and 7 September was calculated; this period was chosen, because it represented the period during which the tagged Pacific halibut in all regions persistently occupied, on average, their shallowest depths. For each migratory individual, an autumn departure date was then identified that represented the date on which the fish descended below the regional average depth and persistently occupied deeper water thereafter. Based on this date, the average temperature experienced by the individual was then computed for the 1-week period (i.e., 168 h) immediately prior to its departure to deep water, as well as for each of the three 1-week periods prior to that (i.e., producing 4 weekly values spanning the 4 weeks prior to autumn departure). Mean summer temperatures experienced among fish within each region were compared to determine whether fish inhabiting different regions had experienced significantly different pre-migration conditions. Within regions, the five sequential temperatures were compared to determine whether conditions changed significantly in the weeks prior to offshore migration, and to potentially identify threshold temperature(s), or net change in temperature, that might have initiated migration.
Statistical analyses
For all fish for which a date of tag detachment was obtained, the relationship between mean fish length and tag-retention period (i.e., to test whether subsequent analyses might be size-biased) was examined via linear regression. Regional differences in mean fish lengths, tagging depths, seasonal depth distributions (i.e., mean shallow- and deep-water phase depths), and linear displacement were investigated via multiple analysis of variance (MANOVA) in which region was specified as the independent (categorical) variable and the other factors as dependent. Tukey HSD post hoc multiple comparisons were conducted for factors that were determined to be significant. Regional variance in the proportion of satellite transmissions received per tag, mean temperatures experienced by fish, and the mean number of light-based longitude estimates generated per tag were examine via one-way ANOVA with Tukey HSD post hoc multiple comparisons conducted where significance was detected. Statistical tests were conducted using TIBCO Statistica version 13.5.0.17 (Palo Alto, California, USA) and errors reported in the text of this manuscript will represent one standard deviation unless otherwise specified.
Results
Tag deployments
A total of 145 Pacific halibut were tagged: 115 from 28 May to 31 August 2008; 17 from 6 June to 21 July 2009; and 13 from 11 to 26 June 2016 (Table 1; Fig. 2). Deployments occurred throughout the study area in 2008; but, only at the EBS Shelf Islands in 2009 and only on the northern EBS Shelf Edge in 2016. Tags were deployed in each tagging region roughly in proportion to the abundance of Pacific halibut ≥ 82 cm FL and ranged from a minimum of 18 individuals tagged in the Central Aleutian Islands region to a maximum of 49 individuals tagged along the EBS Shelf Edge (Table 1). Fish ranged from 82 to 171 cm FL. For fish whose tags subsequently produced at least one category of useable data (i.e., final location, light, or depth data; n = 116), significant differences in mean fork length were detected among tagging regions [MANOVA: df (4, 62), F = 7.052, p < 0.001]. Mean fish lengths were not significantly different within the three regions occurring along the Aleutian Ridge or on the EBS Shelf Edge; fish tagged at the EBS Shelf Islands were on average larger than in all other regions (Tables 1 and 2).
Tag and data recoveries: via fishery and satellite
Twenty-one tags were neither physically recaptured nor communicated via satellite and were, therefore, lost entirely. An additional three tags produced satellite uplinks that were of insufficient strength to determine their final positions or upload any data. Of the remaining 121 fish, two that had been tagged with Mk10s were recaptured in commercial fisheries prior to scheduled tag reporting, after periods at liberty of 11 and 343 days; both had been tagged at St. Matthew Island. Tags from 119 fish generated endpoint locations via satellite transmission: 76 of these reported within the specified annual-displacement window of 360–370 days at liberty; 43 reported after shorter periods, ranging from 14 to 343 days. Fork length was not found to be a significant determinant of tag retention periods; i.e., smaller fish did not shed their tags at a significantly higher rate than larger fish [linear regression: df (1, 112), F = 0.028, p = 0.870, R2 = 0.0002].
The proportion of binned data that were received via satellite broadcast from tags that transmitted data summaries was highly variable, ranging from 7.0 to 96.7%. Mean proportion of data received varied significantly [ANOVA: df (4, 112), F = 3.893, p = 0.005] by region, as follows: Western Aleutian Islands = 59.6 ± 13.1%; Central Aleutian Islands = 61.5 ± 13.1%; Transition Zone = 57.8 ± 19.6%; Eastern Bering Sea Shelf Edge = 73.2 ± 24.3%; Shelf Islands = 77.9 ± 24.3%. Tukey HSD post hoc comparisons indicated that reception rates were similar among the regions located along the Aleutian Ridge and significantly higher, and similar to each other, for the Eastern Bering Sea Shelf Edge and Shelf Islands.
None of the tags that were deployed in 2016 (i.e., PSAT Flex) were recaptured within their first year at liberty, successfully communicated via satellite, or produced data downloads. However, three tags were recovered in longline fisheries on dates that were later than the tags had been programmed to detach and report, their batteries having failed prematurely. These tags were recovered after periods at liberty of 701, 777, and 1155 days at liberty. Although no environmental data were obtained for these fish, final coordinates were obtained for two that were recaptured in US waters. The third was recaptured in Russian waters in the Western Bering Sea (i.e., coastal Kamchatka) and a precise location was not obtained. These fish were recovered in late spring and summer (i.e., late May, July, and August, respectively) and so their recoveries will be plotted; however, their final locations will not be included in calculations of regional dispersal, having not satisfied the criterion of occurring within a multiple of 360–370-day post-release. In addition to tags recaptured in fisheries, seven tags (all Mk10s) were found awash after having broadcast their data and producing final positions. These tags were downloaded to recover their full scheduled-broadcast records.
Displacement and interannual dispersal
Endpoint-derived mean interannual linear displacements (Table 3) were greatest for the Transition Zone; somewhat lower for the EBS Shelf Edge and Shelf Islands; and lowest in the Western and Central Aleutian Islands. However, variance in displacements was high in all regions and none of the observed differences were statistically significant [MANOVA: df (4, 62), F = 1.677, p = 0.167]. Interannual dispersal was characterized by the following general patterns (Fig. 2): (1) for Pacific halibut tagged in the Western and Central Aleutian Islands, all final tag-reporting locations were within the region in which the fish had been tagged; (2) Pacific halibut tagged in the EBS moved among tagging regions and among IPHC regulatory areas with final locations that were exclusively within the Bering Sea, ranging from the Gulf of Anadyr, Russia, to Bristol Bay, Alaska; (3) Pacific halibut tagged in the Transition Zone displayed the greatest amount of emigration from their tagging region, with migrants dispersing across the GOA as far south as coastal Washington State.
For Pacific halibut tagged in the Aleutian Islands, interannual displacement was confined to the Island group that defined each tagging region: i.e., for the Western Aleutians, fish remained resident within the Near and Rat Islands group, bounded between Near Strait to the west and Amchitka Pass to the east; for the Central Aleutians, interannual displacement was confined to the Andreanof Islands between Amchitka and Amukta Passes (Fig. 2). From a fishery-management perspective, this represented retention within IPHC Regulatory Area 4B (Fig. 1). Pacific halibut that were tagged in the EBS were more dispersive than observed in the Aleutian Island regions. Those that departed the EBS Shelf Islands dispersed either eastward on the EBS shelf (n = 1) or northwestward into Russia waters (n = 1). Those that departed the EBS Shelf Edge displayed similar behavior, moving into the shallow waters of Bristol Bay (n = 2) and into Russian waters (n = 2) from just westward of the Russian EEZ boundary to the Gulf of Anadyr. The fish that was physically recaptured in coastal Kamchatka after roughly 3 years at liberty brought the total number of Pacific halibut that had dispersed to Russian waters to four, resulting in ~ 14% interannual emigration to Russia for fish tagged in the EBS.
Within the Transition Zone, Pacific halibut that were tagged north of Unimak Pass produced final endpoints that were exclusively within the Bering Sea (n = 6), within IPHC Regulatory Area 4A. One of these fish was recaptured in August of 2010, after 2 years at liberty (771 days), to provide a third known location: it was captured in northern Area 4A, approximately 2 km from its initial release location. In contrast, fish that were tagged south of Unimak Pass (i.e., in the far-western GOA; southern Regulatory Area 4A) emigrated at a relatively high rate (~ 55%), exclusively eastward, dispersing among IPHC Regulatory Areas: 4A (n = 5), 3B (n = 4), 3A (n = 1), and 2A (n = 1). One fish that emigrated to Regulatory Area 3B after 1 year at liberty was subsequently recaptured in its third summer at liberty (1117 days) and had moved farther eastward into Regulatory Area 3A.
At-liberty dispersal inferred from light data
A total of 109 tags generated twilight data that allowed for the estimation of daily local noon (Table 1), producing 5313 daily longitudes estimates, while those fish were at liberty (Table 3). The number of at-liberty position estimates per fish ranged from 1 to 152 and averaged from 41 to 66, depending upon region (Table 3). However, no significant differences were detected in the average number of longitude estimates per fish among regions [one-factor ANOVA: df (4, 104), F = 1.541, p = 0.196].
For the Western and Central Aleutian Islands, inspection of individual light-based longitude trajectories (36 of 40 tags; Table 1) did not yield sufficient evidence to conclude that any individual fish had departed its tagging region during its time at liberty. That is, despite those individuals having generated numerous light-based longitudes to both the east and west of their regions’ boundaries, no individual generated five consecutive estimates that would have plausibly placed that individual outside of its tagging region. Similarly, out-of-region movement could not be identified for any fish tagged on the EBS Shelf Edge or at the Shelf Islands, including for individuals whose final positions unequivocally demonstrated that they had departed the region. In contrast, seasonal departure followed by return to the tagging region was evident for two fish tagged in the Transition Zone south of Unimak Pass (Fig. 4a, b, upper panels). These individuals departed the Transition Zone between late September and early December, spent 4–5 months in IPHC Regulatory Areas 3B and 3A, and returned to Regulatory Area 4A in late April. Their longitudinal migrations were coincident with movement to deep water in autumn and return to the depths at which they had been tagged in spring (Fig. 4a, b, lower panels). Light-based longitudes also allowed for the timing of regional departure to be identified for two migratory individuals. The first of these fish (Fig. 3b) departed the Transition Zone at the end of December. The second (Fig. 3c) produced considerably fewer position estimates, but the available data suggest November departure. As with the seasonally migratory individuals, the longitudinal migrations of these fish were associated with movement to deep water during winter.

Light-based latitude estimates (upper panels) and daily maximum depth profiles (lower panels) during 2008 and 2009 for: a, b two Pacific halibut (Hippoglossus stenolepis) tagged with pop-up archival transmitting tags in the far-western Gulf of Alaska, and; c one Pacific halibut tagged at the Pribilof Islands in the eastern Bering Sea, from date of tagging (top of upper panels) to date of final tag reporting (bottom of upper panels). All data were obtained via satellite transmission (i.e., the tags were not recovered). The approximate longitudinal span of International Pacific Halibut Commission regulatory areas is indicated by shading. All three fish moved to deep water during the winter and returned to shallow water in spring. Eastward seasonal emigration is clearly evident in a and b. The fish depicted in c is known to have emigrated from its tagging area on the basis of its mid-winter depths (i.e., no such depths occur at the Pribilof Islands), but neither the timing or magnitude of its emigration can be determined. Longitude estimates are absent during its deep-water phase; the remainder of the profile is characterized by apparent measurement error of 5–7° relative to the fish’s known endpoint positions
For Pacific halibut that were tagged in the EBS (on both the Shelf Edge and at the Shelf Islands), light-based longitude estimates provided little information regarding their movements. Many of their interannual displacements were relatively short distance and, for fish whose migrations were considerable, their movements were executed to a considerable degree along north–south vectors (Fig. 2). Such movements are not well-resolved by longitudinal position estimates.
Pooled among all individuals tagged within each region, unstandardized light-based at-liberty longitude estimates for Pacific halibut tagged along the Aleutian Ridge (Fig. 5) displayed some clear seasonal trends. A decrease during winter in the frequency with which estimates were generated was apparent in all regions, and most evident in the Western Aleutian Islands (Fig. 5a). This was coincident with movement to deeper water (see next section), with fish reaching depths at which ambient light levels are expected to be below the tags’ detection thresholds. For fish tagged in the Transition Zone (Fig. 5c), progressive eastward redistribution was apparent after October. As with the individual trajectories, pooled unstandardized longitudinal data for Pacific halibut tagged in the EBS regions were relatively uninformative with respect to seasonal and interannual redistribution.

Light-based longitude estimates during periods at liberty for all Pacific halibut (Hippoglossus stenolepis) tagged with pop-up archival transmitting tags in the a Western and b Central Aleutian Islands, and c Transition Zone between the eastern Aleutians, Southeastern Bering Sea, and western Gulf of Alaska, from dates of tagging (top of panels) through final tag reporting (bottom of panels). Dashed lines indicate ocean passes separating regions located along the Aleutian Ridge and the approximate extent of International Pacific Halibut Commission Regulatory areas in the Gulf of Alaska. Note that the Western Aleutians and the Komandorskiye Ostrova are located in the eastern hemisphere, with the Antimeridian bisecting IPHC Regulatory Area 4B at approximately Amchitka Pass
In all regions other than the Transition Zone, pooled standardized at-liberty longitude estimates were described by a single frequency mode (Fig. 6) that was centered within one degree of longitude relative to the fishes’ tagging locations: displacement in the mean and median was small (< 0.25°) in the Western Aleutians and on the EBS Shelf Edge; and somewhat larger (0.75–0.91°) for the Shelf Islands and Central Aleutians (Table 4). These frequency distributions displayed positive (eastward) skew, which was relatively minor in the EBS (< 0.6) and moderate in the Aleutian Island regions (~ 1.4). Few longitude estimates occurred beyond ~ 5° of the median and those observations were symmetrically distributed, consistent with the occurrence and magnitude of the apparent random measurement error that was evident in many of the individual longitude trajectories (e.g., Fig. 4c). In contrast, fish tagged in the Transition Zone produced a distinctly bimodal distribution of standardized longitude estimates composed of a primary mode positioned ~ 1.2° westward of the fishes’ tagging locations and a smaller secondary mode centered ~ 13° eastward, in the Gulf of Alaska. The secondary mode was consistent with winter locations of fish that were determined to be seasonally migratory (Fig. 4).

Frequency distributions of light-based at-liberty location (longitude) estimates obtained for Pacific halibut (Hippoglossus stenolepis) tagged with pop-up archival transmitting tags during 2008 and 2009 in the Aleutian Islands, Eastern Bering Sea (EBS), and a Transition Zone between those ecosystems and the western Gulf of Alaska. Values have been standardized to reflect degrees westward (negative values) or eastward (positive values) of each fish’s known initial tagging location. The vertical dashed line in each panel indicates a value of 0, such that distributions not centered at that location indicate substantial residency of the tagged halibut at some distance away from their initial longitudes
Seasonal depth distributions
The timing of tagging and, therefore, the precise span over which depth data were available varied by tagging region. For the purposes of plotting and analysis, the “year” over which depth data were included was defined as the 365-day period over which the greatest amount of data was available among all regions: from 19 June of the tagging year through 18 June of the subsequent year. This provided contiguous data for all regions except the Western Aleutian Islands. Fish were tagged earlier in the Western Aleutians than in other regions, resulting in data that terminated approximately 2 weeks earlier than elsewhere: i.e., on 3 June of the year after tagging. The analyses presented subsequently demonstrate that terminating all regions’ depth profiles on 3 June to maintain a unified period among all regions would have been inappropriate: in some regions, the tagged population’s deep-water phase extended beyond that date.
Mean tagging (fish-release) depth varied significantly among regions [MANOVA: df (4, 62), F = 2.64, p < 0.042]. This was expected, given that the regions in the EBS were chosen to represent depth-specific habitat. As such, mean tagging depth (Table 5) was significantly (Tukey HSD, p = 0.021) greater for fish released along the EBS Shelf Edge than at the Shelf Islands; no other pairwise comparisons were significant (Table 2).
Mean depths during the tagged individuals’ summertime shallow-water phases (Table 5; Fig. 7) varied significantly among regions. Mean shallow-water phase depths for fish tagged on the EBS Shelf Edge were significantly greater than for fish in all other regions (all comparisons: Tukey HSD, p < 0.001) and shallow-water phase depths for fish tagged in the Western Aleutian Islands were greater than at the EBS Shelf Islands (Tukey HSD, p = 0.038). No other pairwise comparisons were significant at p ≤ 0.05. For the most part, relative differences in depth distribution persisted throughout the fishes’ movements to deeper water during the winter (Table 5; Fig. 7), with one exception: Pacific halibut tagged at the EBS Shelf Islands exhibited the deepest mean deep-water phase (563 ± 156 m), while in no other region did the mean deep-water phase exceed 500 m. Fish tagged in the Transition Zone displayed the shallowest deep-water phase, averaging 369 ± 69 m. Differences were significant between the Shelf Islands and the Central Aleutian Islands (Tukey HSD, p = 0.028), between the Shelf Islands and the Transition Zone (Tukey HSD, p = 0.002), and between the EBS Shelf Edge and the Transition Zone (Tukey HSD, p = 0.034).

Three-day moving averages of maximum daily depth for Pacific halibut (Hippoglossus stenolepis) tagged with pop-up archival transmitting tags during 2008 and 2009 in the Aleutian Islands, Eastern Bering Sea, and a Transition Zone between those ecosystems and the western Gulf of Alaska. Note that these profiles include all individuals for which depth data were generated, even if they did not conduct an offshore migration (e.g., see Fig. 3a, lower panel) and, therefore, tend to result in group-level mid-winter depths that are shallower than the group’s average deep-water phase depth (i.e., Table 5)
In addition to the observed differences in phase-specific mean depths (Table 5), the timing of offshore–onshore redistribution, length of deep-water residency, and general form of the mean maximum daily depth (MMDD) trajectories differed among tagging regions. Pacific halibut tagged in both Aleutian regions behaved similarly, arriving on average in relatively deep water in mid-November and returning to shallower water in May. Deep-water phase duration and depth were shorter and shallower, respectively, in the Transition Zone than farther westward in the Aleutians (Table 5); however, the form of the MMDD trajectories was quite similar for all three regions (Fig. 7a). In contrast, fish tagged in the EBS arrived at deep-water grounds approximately 1 month later than along the Aleutian Ridge and did not return to shallow water until June (Table 5; Fig. 7). Unlike in all other regions, Pacific halibut tagged at the EBS Shelf Islands displayed a distinctly bi-phasic offshore migration, initially moving from December until late February to depths of approximately 300 m, then descending to > 400 m during March and April (Fig. 7b).
Mean temperatures experienced during midsummer by seasonally migratory Pacific halibut (Table 6) varied significantly [ANOVA: df (4, 51), F = 35.264, p < 0.001] according to tagging region. Tukey HSD post hoc comparisons indicated that the temperatures experienced were similar among regions located along the Aleutian Ridge and significantly lower for fish tagged on the Eastern Bering Sea Shelf Edge and at the Shelf Islands. In no region was a significant change in the experienced temperatures detected between midsummer and any of the four 1-week periods prior to the initiation of departure to deeper water in autumn.
Discussion
The current study builds upon prior analyses of relative spawning segregation [4] and genetic population structure [6, 7] to enhance our understanding of connectivity within the Pacific halibut stock of the eastern Bering Sea and Aleutian Islands. The Pacific halibut that were tagged herein exhibited basin-specific dispersal in which fish tagged in the Bering Sea had summer distributions that were within the Bering Sea, while fish tagged south of Unimak Pass were more dispersive and either occupied or transited all IPHC regulatory areas in the Gulf of Alaska and US Pacific Northwest. Within the BSAI region, Pacific halibut tagged in the Central and Western Aleutian Islands remained within their island groups (i.e., within the Andreanof and Near-Rat Islands, respectively), while those tagged on and along the EBS continental shelf moved among Bering Sea regulatory areas and from Alaskan to Russian waters. These dispersal patterns are consistent with summer-to-winter PAT-tagging studies that have indicated basin-scale reproductive segregation with considerable mixing within those basins [4]; research that has shown Samalga Pass to be an oceanographic [39] and ecological [40,41,42] boundary within the Aleutian Island ecosystem; and population-genetic analyses that suggest relative isolation of Pacific halibut in the Aleutian Islands westward of Amchitka Pass [7]. In addition, light-based geolocation demonstrates that connectivity among regulatory areas may be seasonally cyclic, with fish emigrating from their tagging region for the winter and returning the following spring. This was evident at both the individual and population level for fish tagged south of Unimak Pass.
In contrast to the large degree of out-of-area movement demonstrated by Pacific halibut tagged south of Unimak Pass, there was insufficient evidence to suggest movement of tagged fish out of either the Central or Western Aleutian Islands, at either interannual or seasonal scales. Although numerous tags produced light-based longitude estimates that might have placed them outside of these regions, inspection of the individual trajectories failed to reveal series of consecutive estimates indicative of east–west redistribution beyond the regions’ boundaries, and the distribution of pooled, standardized values in both Aleutian regions showed little skew and no secondary peaks consistent with cross-pass movement. Rather, the nature of the longitude estimates to the east and west of the passes that define the Aleutian tagging regions was most consistent with estimation error induced by local environmental conditions biasing the perception of local noon relative to its true value [35].
Although light-based geolocation failed to resolve seasonal movement among areas in the EBS—perhaps due to the ability of individuals to migrate from summer feeding sites to deeper-water spawning grounds without moving considerably along east–west axes—the endpoint data clearly demonstrated interannual migration from the USA into Russian waters (n = 4). Ultimately, movement between North American and Asian waters on the northern Bering Sea continental shelf is not surprising: there are no known oceanographic or geological features that might impede such connectivity. Rather, larval transport modelling predicts that some proportion of larvae spawned in the EBS are likely to be delivered to Russian coastal habitat [43], and our understanding of ontogenic [9, 10] and seasonal [4, 5, 44] cross-basin movements in the GOA should lead to an expectation of considerable cross-basin mixing in the Bering Sea, particularly at young ages. Both systems are characterized by spawning that is concentrated in submarine canyons along their eastern and central margins, and westward-flowing shelf-edge currents [45, 46]. Basin-scale connectivity over the course of Pacific halibut life history is likely to display approximately the same spatial structure in both systems. Within the Bering Sea, individuals that are derived from EBS spawning and which settle in nurseries along the Asian coast should be expected to return to the North American spawning stock if the population is to maintain long-term stationarity. It is perhaps only surprising that the current study detected as much interannual migration to Russian waters as it did, given that those movements are counter to the expected direction of mean population-level dispersal of benthic-stage individuals: i.e., from west to east. This would suggest that overall migration rates across the Russia–USA maritime border are non-trivial, which is an important observation from the perspective that stock assessment modelling, policy analyses, and management decisions have traditionally assumed that Pacific halibut in waters of Canada and the USA exist in a closed system in which there is no exchange with population(s) in the western half of the species’ geographic range. The omission of this connectivity when characterizing the function of EBS Pacific halibut stocks to-date [e.g., 3, 4, 9] is likely due to an absence of data regarding its magnitude and dynamics. Future work should seek to generate migration-rate data along this axis.
The observation that out-of-area dispersal was highest for Pacific halibut that were tagged in the far-Western GOA is consistent with prior PIT-tagging research [9] in which approximately 90% of the fish that emigrated eastward from IPHC Regulatory Area 4A into GOA regulatory areas were individuals that had been tagged south of the Aleutian Ridge. The spatial discontinuity in connectivity within this region (i.e., very different mixing patterns on opposite sides of the Aleutian Ridge) highlights the challenges associated with defining management subregions that are intended to represent stock structure and function [3] when constrained to the boundaries of historical management units that may not have been ideally crafted to do so. For assessment and policy purposes, data obtained from Regulatory Area 4A are assigned to Bioregion 4 [3], which largely describes stock status and dynamics of the eastern Bering Sea. However, the current results demonstrate that dispersal from IPHC Regulatory Area 4A is more complex: 4A North represents the EBS, while 4A South represents the western GOA and the individuals tagged within it displayed considerable movement across the GOA and into the US Pacific Northwest.
With respect to seasonal migration and depth-specific habitat usage, regional differences were apparent. In the EBS, Shelf Island fish moved to deeper winter spawning habitat than fish tagged along the Shelf Edge, despite having summered in relatively shallower water that was considerably farther from their shelf-edge winter destinations. In addition, the annual depth trajectories of Shelf Island fish were on average considerably more biphasic (i.e., dual-stage) than observed on the Shelf Edge. This dual-stage movement pattern is common in individuals and, in cases in which the data allow for a detailed evaluation of active spawning (i.e., putative egg release) [12, 36, 38], appears to represent an initial period of pre-spawn staging that is followed by active spawning at the deeper stratum. The depths associated with each stratum vary according to individual and examples of dual-stage movement occurred in all tagging regions in the current study. Ultimately, the dual-stage nature of the group-level MMDD profile for Shelf Island fish derives from these fish having exhibited more-synchronous movements than were observed elsewhere. In other regions, individual dual-stage migrations were obscured by averaging among individuals that did so with variable timing. In addition, differences in sex ratio among tagged individuals within each region could obscure this pattern, if one sex more consistently undertakes dual-stage migration than the other. We are unable to address that hypothesis here, because reliable techniques for evaluating sex without sacrificing the individuals had not yet been developed and sex was, therefore, unknown. However, taken together, the displacement, at-liberty longitude estimates, and depth profiles suggest that the Pacific halibut tagged along the Shelf Edge and at the Shelf Islands likely occupied the same regional slope spawning grounds (i.e., in Pribilof, Pervenets, and Zhemchug Canyons; Fig. 1) [12], but with somewhat different timing and depth preferences.
Pacific halibut recruitment is believed to be environmentally driven, via favorable plankton productivity or larval transport [47] and the maintenance of broad spawning and migratory periods in marine fish populations likely represents ecological bet-hedging [48] that ensures long-term recruitment success and stock productivity. Evidence of migratory contingency has been observed in Pacific halibut in the Gulf of Alaska [14] and US Pacific Northwest [16], and analyses suggest that Pacific halibut in the EBS have exhibited shifts in their distribution and habitat use over the last three decades in response to changing ocean temperatures [49, 50]. Maintaining a diversity of life-history strategies may be critical to the successful management of exploited stocks. Parameterizing the timing and duration of larval release, and the depths (i.e., current regimes) into which larvae are released, is required for the construction of larval transport models and for evaluating relative recruitment potential among population components.
Pacific halibut tagged along the Aleutian Ridge, in both the Aleutian Islands and the far-western GOA, were observed to move to deep water and return to shallow habitat roughly 1 month earlier than fish tagged in the EBS and there was evidence of a gradual advancement in the timing of deep-water occupancy moving anticyclonically from the Western Aleutians to the EBS Shelf. Although the available data did not provide any evidence of a threshold temperature, or change in local temperature, that might initiate the autumn offshore migration, the observation that fish residing in cooler waters departed later in the year is consistent with findings from research conducted both to the south and north of the current study. Pacific halibut tagged in the eastern Gulf of Alaska have been shown to initiate offshore migrations as early as September and largely arrive at their wintertime depths by the end of October [12]. Emerging data suggest that Pacific halibut that summer in Norton Sound (Fig. 2), in the northeastern Bering Sea, may move to deep water as late as March and spawn in April and May (A Flanigan, University of Alaska Fairbanks, USA, personal communication). Similarly, latitudinal gradients in spawn timing have been reported for North Pacific starry flounder (Platichthys stellatus) and rex sole (Glyptocephalus zachirus). Spawning in these species occurs approximately 4 months earlier off the coast of California than in the southeast Bering Sea [51].
In addition to its ramifications on interannual recruitment potential and vulnerability to seasonal fisheries [12], regional variance in seasonal migration timing can affect our understanding of the distribution and demographic structure of populations via their interactions with survey design. For example, the depth trajectories in the EBS remained upward-sloping throughout June and into July of 2009 (i.e., the year after tagging), indicating that these fish were still in the process of returning to their summer habitat when the assessment surveys commenced. In the EBS, two platforms are used to index the abundance of Pacific halibut: the IPHC FISS that intensively surveys the continental shelf edge and US National Marine Fisheries Service trawl surveys [52] within shallower continental shelf habitat. Because catchability varies between the two survey techniques and they can be conducted with slightly different timing in any given year, our perception of fine-scale distribution and habitat use may be affected. Differences in relative catchability can be interpreted as differences in underlying abundance even in a homogeneous population. Relative survey timing can either oversample or undersample the population if the timing of the surveys does not correspond with timing of onshore–offshore migration. For example, an early trawl survey might sample inshore waters prior to the arrival of seasonal migrants and the setline survey subsequently occupy the slope after fish have departed, such that neither survey fully indexes the population. A better understanding of the timing of these movement and their interannual variability would be required to understand to what extent such mismatch is likely in any given year, but the ultimate result may be time-varying selectivity within each survey that should be accounted for in the assessment models. The IPHC stock assessment does have a structure that can account for time-varying selectivities [53] and the effects of seasonal migration on fishery selectivity [54] and the incorporation of time-varying functions in assessment models [e.g., 55, 56] has received attention in the literature.
Inspection of Pacific halibut depth profiles also highlights the difficulty of evaluating at-liberty movements for any given individual in the absence of highly resolved location data. For example, fish tagged along the EBS Shelf Edge were found at shallower average depths in July of 2009 than they had occupied when they were tagged. This suggests that their preferred summer habitat was likely shallower in 2009. However, from the available data is it difficult to identify the precise nature of the habitat shift nor identify its driver(s). In particular, light-based longitudinal estimates provided little information regarding their movements (e.g., relative to fish located along the Aleutian Ridge), because large-scale redistribution may occur on the EBS continental shelf along north–south axes. The associated changes in stock distribution may be quantifiable through refined methodology, such as advanced mobile acoustics [57, 58], ongoing developments in geomagnetic-sensing electronic tags [59, 60], and the adaptation of statistical models for tracking benthic and epibenthic marine species [24,25,26]. In addition, the use of mark-report PAT tags, which generate pop-up locations in the absence of archived environmental data and, therefore, cost considerably less than standard PAT tags, could be considered. Large-bodied species such as Pacific halibut can be tagged with multiple such tags that are programmed to release at any desired interval, providing more-detailed migration histories than can any single pop-up tag [sensu 61] as well as providing validated locations to increase the accuracy of tracking models [62].
Ultimately, to fully understand population ecology in Pacific halibut we will need to fill the scaling-gaps that exist within the existing data: in particular, a lack of information describing generational-scale processes and information on sex-specific behavior. With respect to the latter, ultrasonic [63] and genetic techniques [64] have now been developed that allow for determination of the sex of Pacific halibut during tagging and can be employed in future work. With respect to the former, the interannual time scales addressed herein are still far from generational in this species. Although it is rare for satellite-tagging studies to exceed 1 year due to hydraulic drag effects [65], tag shedding [66], and biofouling [67], the general lack of fouling and wear on PAT tags that have been physically recovered on Pacific halibut, after 2–3 years at liberty in the current study, suggests that PAT-tagging can likely be conducted at multi-year time scales for this, and similar, species. In addition, the tags used in the current study (i.e., Mark 10 PAT tags) were considerably larger than current-generation satellite tags and tended to suffer higher failure rates than more-recent studies on Pacific [e.g., 68] and Atlantic [38, 69] halibut. Furthermore, the IPHC has developed both surgical [70] and external [71] tagging techniques resulting in in situ retention periods in excess of 6 years and electronic archival tag manufacturers currently provide multi-sensor tags with operational life and logging capacities on the order of 7–9 years [e.g., Star Oddi (Reykjavik, Iceland) DST-centi (www.star-oddi.com/products/data-loggers/miniature-depth-logger); Lotek Wireless (St. Johns, Canada) LAT-2000 Series (https://www.lotek.com/products/lat2000-series/) archival tags]. Ultimately, there is considerable potential to continue expanding the scope and scale of research on individual behavior and population-level connectivity using advanced electronic-tagging technology and a variety of multidisciplinary approaches.
Availability of data and materials
The data sets generated and/or analyzed during this study are Public Domain, as per the International Pacific Halibut Commission’s (IPHC) current Data Use and Confidentially Policy (dated 2 August 2019), and may be obtained from the IPHC upon request.
References
Carpi P, Loher T, Sadorus LL, Forsberg JE, Webster RA, Planas J, Jasonowicz A, Stewart IJ, Hicks AC. Ontogenetic and spawning migration of Pacific halibut: a review. Rev Fish Biol Fish. 2021;31:879–908. https://doi.org/10.1007/s11160-021-09672-w.
Kong T, Tran H, Prem C. Fisheries data overview (2021). Meeting Document IPHC-2022-AM098–06 Rev_1. Seattle: International Pacific Halibut Commission. 2022. https://www.iphc.int/uploads/pdf/am/am098/iphc-2022-am098-06.pdf. Accessed 20 Feb 2022.
Stewart I, Hicks A, Webster R, Wilson D. Summary of the data, stock assessment, and harvest decision table for Pacific halibut (Hippoglossus stenolepis) at the end of 2021. Meeting document IPHC-2022-AM098-10. Seattle: International Pacific Halibut Commission. 2021. https://www.iphc.int/uploads/pdf/am/am098/iphc-2022-am098-10.pdf. Accessed 20 Feb 2022.
Seitz AC, Loher T, Farrugia TJ, Norcross BL, Nielsen JL. Basin-scale reproductive segregation of Pacific halibut (Hippoglossus stenolepis). Fish Manag Ecol. 2017;24:339–46. https://doi.org/10.1111/fme.12233.
Loher T, Seitz AC. Seasonal migration and environmental conditions experienced by Pacific halibut (Hippoglossus stenolepis), elucidated from pop-up archival transmitting tags. Mar Ecol Prog Ser. 2006;317:259–71. https://doi.org/10.3354/meps317259.
Nielsen JL, Graziano SL, Seitz AC. Fine-scale population genetic structure in Alaskan Pacific halibut (Hippoglossus stenolepis). Conserv Genet. 2010;11(3):999–1012. https://doi.org/10.1007/s10592-009-9943-8.
Drinan DP, Galindo HM, Loher T, Hauser L. Subtle genetic population structure in Pacific halibut. J Fish Biol. 2016;89:2571–94. https://doi.org/10.1111/jfb.13148.
IPHC (International Pacific Halibut Commission). The Pacific halibut: biology, fishery, management. Technical report no. 59. Seattle: International Pacific Halibut Commission. https://www.iphc.int/uploads/pdf/tr/IPHC-2014-TR059.pdf. Accessed 20 Feb 2022.
Webster RA, Clark WG, Leaman BM, Forsberg JE. Pacific halibut on the move: a renewed understanding of adult migration from a coastwide tagging study. Can J Fish Aquat Sci. 2013;70:642–53. https://doi.org/10.1139/cjfas-2012-1371.
Hilborn R, Skalski J, Anganuzzi A, Hoffman, A. Movements of juvenile halibut in IPHC regulatory areas 2 and 3. Technical report no. 31. Seattle: International Pacific Halibut Commission. 1995. https://www.iphc.int/uploads/pdf/tr/IPHC-1995-TR031.pdf. Accessed 20 Feb 2022.
Kaimmer SM. Pacific halibut tag release programs and tag release and recovery data, 1925 through 1998. IPHC technical report no. 41. Seattle: International Pacific Halibut Commission. 2000. https://www.iphc.int/uploads/pdf/tr/IPHC-2000-TR041.pdf. Accessed 20 Feb 2022.
Loher T. Analysis of match-mismatch between commercial fishing periods and spawning ecology of Pacific halibut (Hippoglossus stenolepis), based on winter surveys and behavioural data from electronic tags. ICES J Mar Sci. 2011;68:2240–51. https://doi.org/10.1093/icesjms/fsr152.
Seitz AC, Loher T, Norcross BL, Nielsen JL. Dispersal and behavior of Pacific halibut Hippoglossus stenolepis in the Bering Sea and Aleutian Islands region. Aquat Biol. 2011;12:225–39. https://doi.org/10.3354/ab00333.
Nielsen JK, Seitz AC. Interannual site fidelity of Pacific halibut: potential utility of protected areas for management of a migratory demersal fish. ICES J Mar Sci. 2017;74(8):2120–34. https://doi.org/10.1093/icesjms/fsx040.
Loher T, Blood CA. Seasonal dispersion of Pacific halibut (Hippoglossus stenolepis) summering off British Columbia and the US Pacific Northwest evaluated via satellite archival tagging. Can J Fish Aquat Sci. 2009;66:1409–22. https://doi.org/10.1139/F09-093.
Loher T, Soderlund E. Connectivity between Pacific halibut Hippoglossus stenolepis residing in the Salish Sea and the offshore population, demonstrated by pop-up archival tagging. J Sea Res. 2018;142:13–124. https://doi.org/10.1016/jseares.2018.09.007.
Loher T. Homing and summer feeding site fidelity of Pacific halibut (Hippoglossus stenolepis) in the Gulf of Alaska, established using satellite-transmitting archival tags. Fish Res. 2008;92:63–9. https://doi.org/10.1016/j.fishres.2007.12.013.
Rose GA, Leggett WC. Effects of biomass-range interactions on the catchability of migratory demersal fish by mobile fisheries: an example of Atlantic cod (Gadus morhua). Can J Fish Aquat Sci. 1991;48:843–8.
Rose GA. Cod spawning on a migration highway in the north-west Atlantic. Nature. 1993;366:458–61. https://doi.org/10.1038/366458a0.
Gordoa A, Lesch H, Rodergas S. Bycatch: complementary information for understanding fish behaviour. Namibian Cape hake (M. capensis and M. paradoxus) as a case study. ICES J Mar Sci. 2006;63:1513–9. https://doi.org/10.1016/j.icesjms.2006.05.007.
Hobday AJ, Hartog JR, Timmiss T, Fielding J. Dynamic spatial zoning to manage southern bluefin tuna (Thunnus maccoyii) capture in a multi-species longline fishery. Fish Oceanogr. 2010;19:243–53. https://doi.org/10.1111/j.1365-2419-2010.00540.x.
Keating KA. Mitigating elevation-induced errors in satellite telemetry locations. J Wildl Manag. 1995;59:801–8. https://doi.org/10.2307/3801960.
Block AB, Dewar H, Williams T, Prince ED, Farwell C, Fudge D. Archival tagging of Atlantic Bluefin tuna (Thunnus thynnus thynnus). Mar Technol Soc J. 1998;32:37–46. https://doi.org/10.1007/978-94-017-1402-0_3.
Pederson MW, Righton D, Thygesen UH, Andersen KH, Madsen H. Geolocation of North Sea cod (Gadus morhua) using hidden Markov models and behavioural switching. Can J Fish Aquat Sci. 2018;65(11):2367–77. https://doi.org/10.1139/F08-144.
Le Bris A, Fisher JAD, Murphy HM, Galbraith PS, Castonguay M, Loher T, Robert D. Migration patterns and putative spawning habitats of Atlantic halibut (Hippoglossus hippoglossus) in the Gulf of St. Lawrence revealed by geolocation of pop-up satellite archival tags. ICES J Mar Sci. 2018;75:135–47. https://doi.org/10.1093/icesjms/fsx098.
Nielsen JK, Mueter FJ, Adkinson MD, Loher T, McDermott SF, Seitz AC. Effect of study area bathymetric heterogeneity on parameterization and performance of a depth-based geolocation model for demersal fishes. Ecol Model. 2019;24:18–34. https://doi.org/10.1093/icesjms/fsx040.
Stabeno P, Ladd C, Napp JM. Transport through Unimak Pass, Alaska. Deep-Sea Res. 2002;II(49):5919–30. https://doi.org/10.1016/S0967-0645(02)00326-0.
Lanksbury JA, Duffy-Anderson JT, Mier KL, Bisby MS, Stabeno PJ. Distribution and transport patterns of northern rock sole, Lepidopsetta polyxystra, larvae in the southeastern Bering Sea. Prog Oceanogr. 2007;72(1):39–62. https://doi.org/10.1016/j.pocean.2006.09.001.
Wright DL, Castellote M, Berchok CL, Ponirakis D, Crance JL, Clapham PJ. Acoustic detection of North Pacific right whales in a high-traffic Aleutian Pass, 2009–2015. Endanger Species Res. 2018;37:77–90. https://doi.org/10.3354/esr00915.
Ualesi K, Wilson D, Jones C, Rillera R, Jack T. IPHC fishery-independent setline survey (FISS) design and implementation in 2020. Meeting document IPHC-2022-AM098-07. Seattle: International Pacific Halibut Commission. 2021. https://www.iphc.int/uploads/pdf/am/am098/iphc-2022-am098-07.pdf. Accessed 20 Feb 2022.
Courcelles D. Re-evaluation of the length-weight relationship of Pacific halibut (Hippoglossus stenolepis). In: Sadorus L, editor. Report of assessment and research activities 2011. Seattle: International Pacific Halibut Commission; 2012. p. 459–70.
Hare SR. Investigation of the role of fishing in the Area 4C CPUE decline. In: Sadorus L, editor. Report of assessment and research activities 2004. Seattle: International Pacific Halibut Commission; 2005. p. 185–97.
Loher T. Investigating variability in catch rates of halibut (Hippoglossus stenolepis) in the Pribilof Islands: is temperature important? Deep-Sea Res. 2008;II(55):1801–8. https://doi.org/10.1016/j.dsr2.2008.04.002.
Lynch P. The equation of time and the analemma. Irish Math Soc Bull. 2012;69:47–56.
Seitz AC, Norcross BL, Wilson D, Nielsen JL. Evaluating light-based geolocation for estimating demersal fish movements in high latitudes. Fish Bull. 2006;104:571–8.
Seitz AC, Norcross BL, Wilson D, Nielsen JL. Identifying spawning behavior in Pacific halibut, Hippoglossus stenolepis, using electronic tags. Environ Biol Fish. 2005;73:445–51. https://doi.org/10.1007/s10641-005-3216-2.
Loher T, Seitz AC. Characterization of active spawning season and depth for eastern Pacific halibut (Hippoglossus stenolepis), and evidence of probable skipped spawning. J Northwest Atl Fish Sci. 2008;41:23–36. https://doi.org/10.2960/j.v41.m617.
Fisher JAD, Robert D, Le Bris A, Loher T. Pop-up satellite archival tag (PSAT) temporal data resolution affects interpretations of spawning behavior and vertical habitat use. Anim Biotelem. 2017;2017(5):27. https://doi.org/10.1186/s40317-017-0137-8.
Ladd C, Hunt GL Jr, Mordy CW, Salo SA, Stabeno PJ. Marine environment of the eastern and central Aleutian Islands. Fish Oceanogr. 2005;14(s1):22–38. https://doi.org/10.1111/j.1365-2419.2005.00373.x.
Coyle KO. Zooplankton distribution, abundance and biomass relative to water masses in eastern and central Aleutian Island passes. Fish Oceanogr. 2005;14:77–92. https://doi.org/10.1111/j.1365-2419.2005.00367.x.
Jahncke J, Coyle KO, Hunt GJ. Seabird distribution, abundance and diets in the central and eastern Aleutian Islands. Fish Oceanogr. 2005;14:160–77. https://doi.org/10.1111/j.1365-2419.2005.00372.x.
Konar BH, Edwards MS, Bland A, Metzger J, Ravelo A, Traiger S, Weitzman BP. A swath across the great divide: kelp forests across the Samalga Pass biogeographic break. Cont Shelf Res. 2017;143:78–88. https://doi.org/10.1016/j.csr.2017.06.007.
Sadorus LL, Goldstein ED, Webster RA, Stockhausen WT, Planas JV, Duffy-Anderson JT. Multiple life stage connectivity of Pacific halibut (Hippoglossus stenolepis) across the Bering Sea and Gulf of Alaska. Fish Oceanogr. 2021;30(2):174–93. https://doi.org/10.1111/fog.12512.
Leaman BM, Geerneart TO, Loher T, Clark WG. Further examination of biological issues concerning an extended commercial fishing season. In: Sadorus L, editor. Report of assessment and research activities 2001. Seattle: International Pacific Halibut Commission; 2002. p. 53–73.
Stabeno P, Schumacher JD, Ohtani K. The physical oceanography of the Bering Sea. In: Loughlin TR, Ohtani K, editors. Dynamics of the Bering Sea. Fairbanks: Alaska Sea Grant; 1999. p. 1–28. https://doi.org/10.4027/dbs.1999.
Stabeno PJ, Bond NA, Hermann AJ, Kachel NB, Mordy CW, Overland JE. Meteorology and oceanography of the Northern Gulf of Alaska. Fish Oceanogr. 2004;10:81–98. https://doi.org/10.1016/J.CSR.2004.02.007.
Clark WG, Hare SR. Effects of climate and stock size on recruitment and growth of Pacific halibut. N Am J Fish Manag. 2002;22:852–62.
Tamario C, Sunde J, Petersson E, Tibblin P, Forsman A. Ecological and evolutionary consequences of environmental change and management actions for migrating fish. Front Ecol Evol. 2019;7:271. https://doi.org/10.3389/fevo.2019.00271.
Vestfals C, Ciannelli L, Hoff GR. Changes in habitat utilization of slope-spawning flatfish across a bathymetric gradient. ICES J Mar Sci. 2016;73(7):1875–89. https://doi.org/10.1093/icesjms/fsw112.
Webster RA, Soderlund E, Dykstra CL, Stewart IJ. Monitoring change in a dynamic environment: spatio-temporal modelling of calibrated data from different types of fisheries surveys of Pacific halibut. Can J Fish Aquat Sci. 2020;77:1421–32. https://doi.org/10.1139/cjfas-2019-0240.
Castillo GC. Latitudinal patterns in reproductive life history traits of Northeast Pacific flatfish. In: Baxter B, editor. Proceedings of the international symposium on North Pacific Flatfish. Fairbanks: Alaska Sea Grant; 1994. p. 51–72. https://repository.library.noaa.gov/view/noaa/38469. Accessed 7 Apr 2022.
Lauth RR, Acuna A. Results of the 2006 eastern Bering Sea continental shelf bottom trawl survey of groundfish and invertebrate resources. NOAA technical memorandum NMFS-AFSC-176. Seattle: US National Marine Fisheries Service. 2007. https://apps-afsc.fisheries.noaa.gov/Publications/AFSC-TM/NOAA-TM-AFSC-176.pdf. Accessed 20 Feb 2022.
Stewart I, Martell S. Development of the 2015 stock assessment. Meeting document IPHC-2015-srb06-02. Seattle: International Pacific Halibut Commission. https://www.iphc.int/uploads/pdf/srb/iphc-2015-srb06-02.pdf. Accessed 7 Apr 2022.
O’Boyle R, Dean M, Legault CM. The influence of seasonal migration on fishery selectivity. ICES J Mar Sci. 2016;73(7):1774–87. https://doi.org/10.1093/icesjms/fsw048.
Wilberg MJ, Thorson JT, Linton BC, Berkson J. Incorporating time-varying catchability into population dynamic stock assessment models. Rev Fish Sci. 2010;18(1):7–24. https://doi.org/10.1080/10641260903294647.
Nielsen A, Berg CW. Estimation of time-varying selectivity in stock assessments using state-space models. Fish Res. 2014;158:96–101. https://doi.org/10.1016/j.fishres.2014.01.014.
Cimino M, Cassen M, Merrifield S, Terrill E. Detection efficiency of acoustic biotelemetry sensors on Wave Gliders. Anim Biotelem. 2018;6:16. https://doi.org/10.1186/s40317-018-0169-4.
Lembke C, Lowerre-Barbieri S, Mann DA, Taylow JC. Using three acoustic technologies on underwater gliders to survey fish. Mar Technol Soc J. 2019;2(6):39–52. https://doi.org/10.4031/MTSJ.52.6.1.
Stockhausen H, Guðbjörnsson S. The earth’s geomagnetic field and geolocation of fish: first results of a new approach. ICES CM. 2009/B:19.
Nielsen JK, Mueter FJ, Adkinson MD, Loher T, McDermott SF, Seitz AC. Potential utility of geomagnetic data for geolocation of demersal fish in the North Pacific Ocean. Anim Biotelem. 2020;8:17. https://doi.org/10.1186/s40317-020-00204-0.
Hussey NE, Orr J, Fisk AT, Hedges KJ, Ferguson SH, Barkley AN. Mark report satellite tags (mrPATs) to detail large-scale horizontal movements of deep water species: first results for Greenland shark (Somniosus microcephalus). Deep Sea Res. 2018;I(134):32–40. https://doi.org/10.1016/j.dsr.2018.03.002.
Gatti P, Fisher JAD, Cyr F, Galbraith PS, Robert D, Le Bris A. A review and tests of validation and sensitivity of geolocation models for marine fish tracking. Fish Fish. 2021;22:1041–66. https://doi.org/10.1111/faf.12568.
Loher T, Stephens SM. Use of veterinary ultrasound to identify sex and assess female maturity of Pacific halibut in nonspawning condition. N Am J Fish Manag. 2011;31:1034–42. https://doi.org/10.1080/02755947.2011.635240.
Drinan DP, Loher T, Hauser L. Identification of genomic regions associated with sex in Pacific halibut. J Heredity. 2018;109(3):326–32. https://doi.org/10.1093/jhered/esx102.
Grusha DS, Patterson MR. Quantification of drag and lift imposed by pop-up satellite archival tags and estimation of the metabolic cost to cownose rays (Rhimnoptera bonasus). Fish Bull. 2005;103(1):63–70.
Jepsen N, Thorstad EB, Havn T, Lucas MC. The use of external electronic tags on fish: an evaluation of tag retention and tagging effects. Anim Biotelem. 2015;3:49. https://doi.org/10.1186/s40317-015-0086-z.
Hammerschlag N, Cooke SJ, Gallagher AJ, Godley BJ. Considering the fate of electronic tags: interactions with stakeholders and user responsibility when encountering tagged aquatic animals. Methods Ecol Evol. 2014;5:1147–53. https://doi.org/10.1111/2041-210X.12248.
Loher T, Dykstra CL, Simeon A, Hicks AC, Stewart IJ, Wolf N, Harris BP, Planas JV. Estimation of post-release mortality using acceleration-logging archival pop-up tags for Pacific halibut (Hippoglossus stenolepis) discarded from longlines. N Am J Fish Manag. 2021;42(1):37–49. https://doi.org/10.1002/najfm.10711.
Le Bris A, Fisher JAD, Murphy HM, Galbraith PS, Castonguay M, Loher T, Robert D. Migration patterns and putative spawning habitats of Atlantic halibut (Hippoglossus hippoglossus) in the Gulf of St. Lawrence revealed by geolocation of pop-up satellite archival tags. ICES J Mar Sci. 2018;1(1):135–47. https://doi.org/10.1093/icesjms/fsx098.
Loher T, Rensmeyer R. Physiological responses of Pacific halibut, Hippoglossus stenolepis, to intracoelomic implantation of electronic archival tags, with a review of tag implantation techniques employed in flatfishes. Rev Fish Biol Fish. 2011;21(1):1027–37. https://doi.org/10.1007/s11160-010-9192-4.
Loher T, Geernaert TO. Captive holding to develop long-term archival tagging protocols in Pacific halibut. In: Sadorus L, editor. Report of assessment and research activities 2015. Seattle: International Pacific Halibut Commission; 2016. p. 445–63.
Acknowledgements
Kathy Bareza, Dan Rafla, Tucker Soltau Andy Vatter and Tom Wilson conducted the tagging described in this study, aboard the fishing vessels Free to Wander, Kema Sue, Pacific Sun, and Saint Peter. Erica Anderson-Chau, Claude Dykstra, Tracee Geernaert, Ed Henry, Eric Soderlund, and Evangeline White provided invaluable logistical assistance through the IPHC Fishery-Independent Setline Survey. Ian Stewart, David Wilson, Josep Planas, and two anonymous reviewers provided feedback and suggestions that improved its quality.
Funding
The sole Funding body for this work was the International Pacific Halibut Commission (IPHC), and all tags were deployed from IPHC-chartered stock assessment survey vessels.
Author information
Authors and Affiliations
Contributions
This study was conceived and planned by TL, who supervised all tag deployments, conducted all analyses, and wrote this manuscript. The author read and approved the final manuscript.
Corresponding author
Ethics declarations
Ethics approval and consent to participate
All tagging was conducted under the auspices of the International Pacific Halibut Commission.
Consent for publication
The author has given his consent to the manuscript being published.
Competing interests
The author declares that he has no competing interests.
Additional information
Publisher's Note
Springer Nature remains neutral with regard to jurisdictional claims in published maps and institutional affiliations.
Rights and permissions
Open Access This article is licensed under a Creative Commons Attribution 4.0 International License, which permits use, sharing, adaptation, distribution and reproduction in any medium or format, as long as you give appropriate credit to the original author(s) and the source, provide a link to the Creative Commons licence, and indicate if changes were made. The images or other third party material in this article are included in the article's Creative Commons licence, unless indicated otherwise in a credit line to the material. If material is not included in the article's Creative Commons licence and your intended use is not permitted by statutory regulation or exceeds the permitted use, you will need to obtain permission directly from the copyright holder. To view a copy of this licence, visit http://creativecommons.org/licenses/by/4.0/. The Creative Commons Public Domain Dedication waiver (http://creativecommons.org/publicdomain/zero/1.0/) applies to the data made available in this article, unless otherwise stated in a credit line to the data.
About this article

Cite this article
Loher, T. Dispersal and seasonal movements of Pacific halibut (Hippoglossus stenolepis) in the eastern Bering Sea and Aleutian Islands, as inferred from satellite-transmitting archival tags. Anim Biotelemetry 10, 18 (2022). https://doi.org/10.1186/s40317-022-00288-w
Received:
Accepted:
Published:
DOI: https://doi.org/10.1186/s40317-022-00288-w